Exploring Factors Affecting Secondary Education and Their Respective Trends
It is now generally accepted that factors like household income serve as strong predictors for student performance in schools. With this in mind, I think we can generally agree that it is not the sole factor of relevance for such a complex topic.
In this study, I, alongside my partner, Khanh, delve into how California school districts and demographics correlate with student performance and demographics. We wanted to explore how things like teacher salary, degree, diversity, and district factors as a whole relate to student performance per district. We set out to find these correlations to do two things: check in on the state of education from the lens of California, and set groundwork for potential future research papers centered around education.
The focal point in our paper was around students which were eligible for free or reduced price meals (we just list this group as FRPM) as well as districts in which a majority over the students were considered FRPM. We worked datasets which were created from accumulating published information from California's Department of Education regarding students, teachers, and schools. This information spans over several topic areas, some being enrollment, assessment, and accountability.
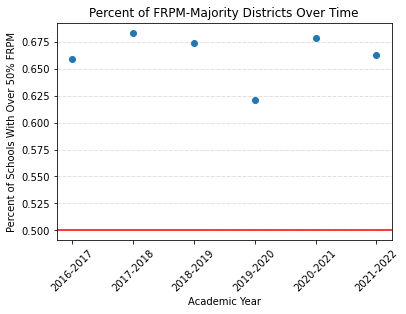
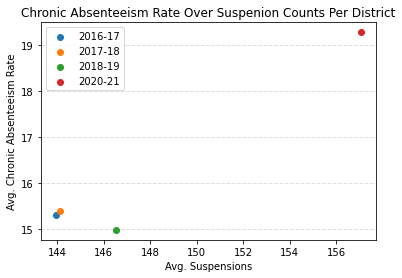
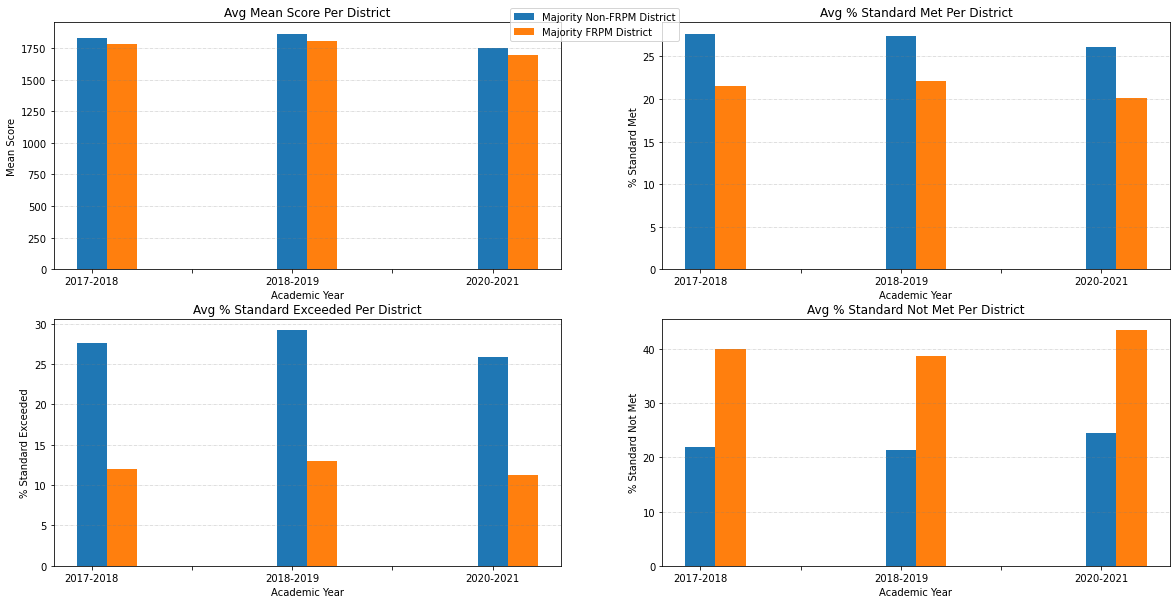
Khanh and I found some mildly disturbing trends from the data. One easily visible example was the sheer disparity between FRPM and non-FRPM [districts'] assessment performance where FRPM districts not only performed worse, but they did so by significant margins. This is coupled with the fact that most districts in California are FRPM and this ratio of FRPM to non-FRPM districts has not budged except for the outlier of when the COVID-19 pandemic first swept the United States. Even then, it was still over 60%. More so, things may get worse as the latest data shows a potential behavioral shift with a large jump in suspensions and chronic absenteeism in students post-pandemic. These combined findings that warrant further study as there may be a need for some sort of intervention in the interest of education.
Khanh and I learned a lot while doing this project. The main platforms/concepts I utilized during the project were:
- SQL
- Python
- NumPy
- GCP BigQuery
- Google Colab
- Data Analysis
Here's some of the findings I discussed above in their visual form!